No one knows what has led to the ‘improvement’; lack of standardised data collection often yields contradictory results, undermines policy evaluation.

The latest edition of IFPRI’s Global Nutrition Report, released on September 22, highlighted the improvements in India, across all states.
When it comes to tackling malnutrition, India has for long been a laggard. Decades of slow economic growth and inefficient primary healthcare provisioning meant that India had worse malnutrition statistics than even some of the sub-Saharan countries. India’s levels of malnutrition, former Prime Minister Manmohan Singh said in January 2012, were a “national shame”.
Fresh data released in July by the Ministry of Women and Child Development, as part of the Rapid Survey on Children (RSOC), however, suggested otherwise.
This latest set of data was used by the International Food Policy Research Institute (IFPRI) to claim that India had made giant strides in improving nutrition between 2004 and 2014. The latest edition of IFPRI’s Global Nutrition Report, released on September 22, highlighted the improvements in India, across all states.

According to RSOC, conducted in 2013-14 by the government and Unicef, stunting (or being too short for their age) among children below the age of 5 had fallen from 48 per cent in 2005-06, according to the National Family Health Survey 3, to 39 per cent in 2014. This reflected almost a doubling of the rate of decline compared with the period 1999-2006 — with the declines being fairly even across states. Other variables such as wasting or exclusive breastfeeding rates, also showed improvements across states, albeit to differing levels.
And yet, far from offering a clear direction for future policymaking, the latest data has only muddied the debate on malnutrition in India. Here’s why.
Between 2004 and 2014, India saw a significant decline in its levels of poverty. The government also took several policy measures to directly influence nutritional outcomes, including ramping up the Integrated Child Development Services (ICDS) scheme, and starting new initiatives like National Rural Health Mission (NRHM) and the Mahatma Gandhi National Rural Employment Guarantee Act, or MGNREGA. At the state level, some governments adopted “Nutrition Missions” to speed up improvements — Maharashtra being a shining example.
Almost all these schemes also suffer from inefficiencies, and it is not clear which scheme or policy initiative has helped, and to what extent. (One argument, in fact, is that the government should focus more on speeding up economic growth instead of wasting money on leaky government schemes.) The latest results of RSOC notwithstanding, it is not even clear whether there have been definite improvements.
The primary reason for this lies in the way India collects its data on malnutrition — which leads to results that often point in different directions.
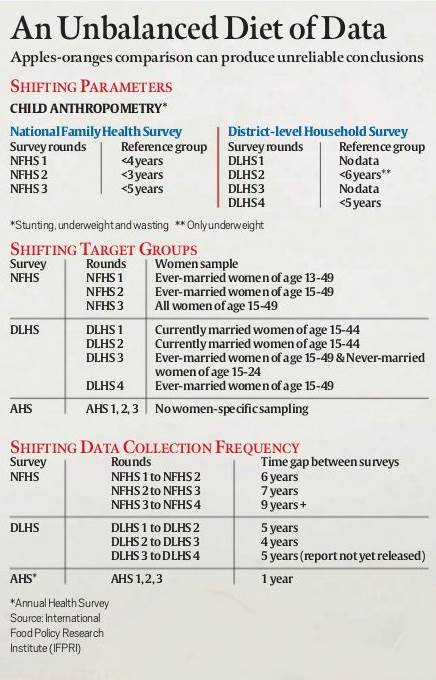
As the tables alongside show, the collection of nutrition data suffers from a lack of standardisation, as a result of which no two sets of data are comparable. This leads to several data gaps, and experts cannot say for sure whether a particular policy was responsible for the improvements or not.
Aparna John and Purnima Menon highlight this issue in Global Nutrition Report 2015. Since 1992, several major nutrition surveys have been conducted in India. There have been three National Family Health Surveys (NFHS) — 1992-1993 (Round 1), 1998-1999 (Round 2), and 2005-2006 (Round 3) — and four District-Level Health Surveys (DLHS) — 1998-1999, 2002-2004, 2007-2008, and 2012-2013. There have also been three Annual Health Surveys (AHS) — 2011, 2012, 2013. Then there have been the one-time surveys — Unicef’s RSOC (2015), and HUNGaMA survey by the Naandi Foundation (2011).
A study of these surveys shows wide variations across their geographical coverage, frequency of data collection, etc. For instance, neither the NFHS nor the DLHS have any comparability when it comes to the targeted respondents among women. Researchers claim that there is little actionable intelligence on which to base policy prescription. Similarly, the shifting reference points for child anthropometry (which includes collecting data on stunting and wasting) ruin any chances of clear deduction in the scale of improvement. The same holds true for the frequency of the surveys.
Not surprisingly then, there is confusion about the true state of malnutrition in India. Until last year, NFHS-3 (2005-06) data was held as the only one that could be quoted. NFHS-4 was delayed, and the results of DLHS-4 (2014) or HUNGaMA (2011) were not comparable to NHFS-3 because they did not cover the whole country.
Moreover, the results of DLHS-4 and HUNGaMA contradicted each other. For instance, data for the 12 best performing districts collected by HUNGaMA showed that the proportion of underweight children under the age of 5 had come down to a third, while DLHS-4, which came three years later, suggested that this figure was still near the 43 per cent level, as shown by NFHS-3 in 2005.
Even with the introduction of RSOC data, it is difficult to say anything conclusively.
This is partly because RSOC is a one-time data set, and the government has itself put a question mark over it by not releasing the detailed state-level factsheet. According to a Ministry press release, a technical committee is reviewing the data.
Research in the field suggests that every dollar invested in improving nutritional outcomes leads to 16 dollars of productivity gains in the labour force.
This alone should be incentive enough for the Indian government to set up a standardised system of data collection for nutrition, which throws up figures that are comparable over time and parameters.

